
 | |
This set of figures shows the full correlation structure for the volatilities evaluated over increasing time intervals. The first figure plots the volatility auto-correlation. The following three figures display the correlation between the realized volatility at time horizon dt' (vertical axis), and another (historical) quantity at time horizon dt (horizontal axis).
Correlations of the volatilities at different time horizonsThe axes give the time horizons of the volatilities. |
|
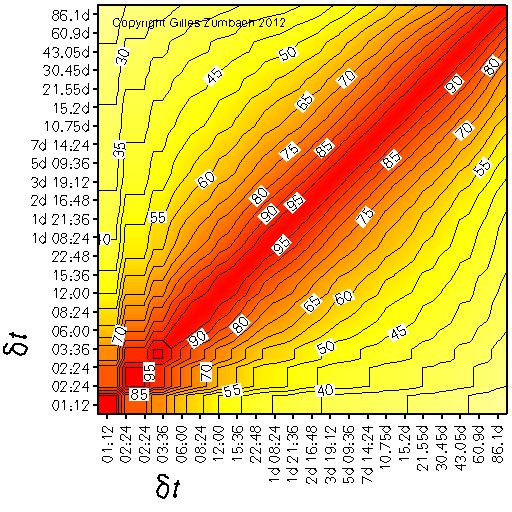 |
The correlation between the historical volatility at time horizon dt (horizontal axis)
and itself at time horizon dt' (vertical axis).
The salient feature on the empirical time series is the slow decay of the correlation with the increasing difference between dt and dt'. |
Correlations of the historical and realized volatilities, at different time horizons |
|
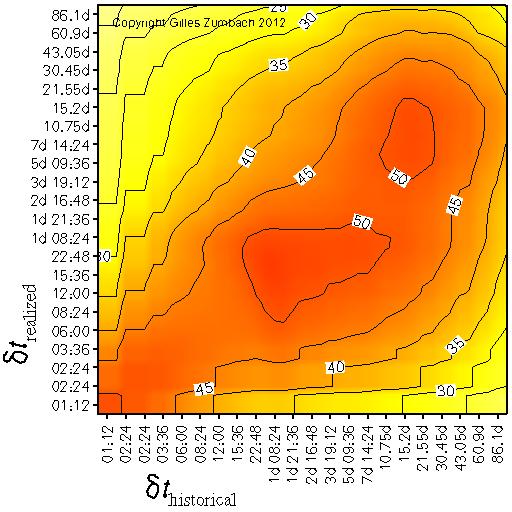 |
The correlation between the historical volatility at time horizon dt (horizontal axis)
and the realized volatility at time horizon dt' (vertical axis).
This figure shows the dependency structure between past and future volatilities.
The salient features of the empirical data are:
|
Asymmetry of the correlations between the historical and realized volatilities, at different time horizons |
|
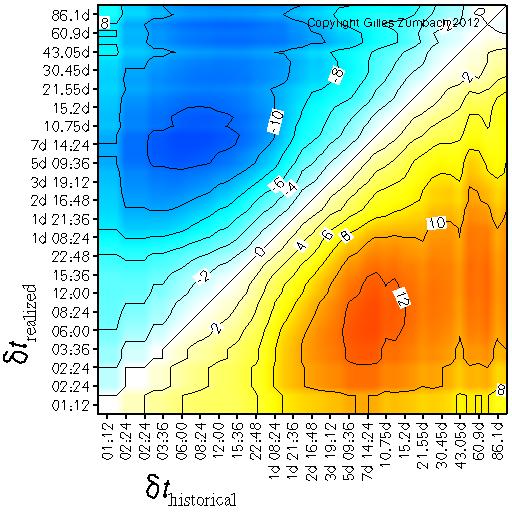 |
The asymmetry in the previous figure.
The asymmetry is a measure of the non invariance with respect to time reversal, namely a time series which is statistically invariant when reversing the arrow of time should have a zero asymmetry. |
Correlations of the realized volatilities with the historical volatility increment |
|
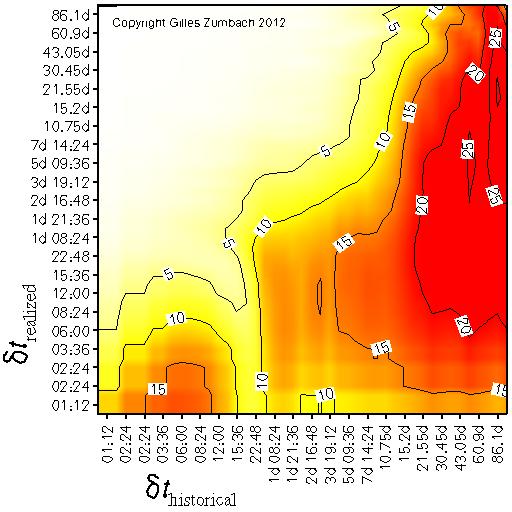 |
The correlation between the historical volatility increment at time horizon dt (horizontal axis) and the realized volatility at time horizon dt' (vertical axis).
This figure shows the dependency structure between past volatility changes and future volatilities.
The empirical correlation shows a very strong asymmetry around the diagonal. In particular, volatility changes at short time horizons have no influence on long time volatility. |
Correlations of the realized volatilities with the centered volatility increment |
|
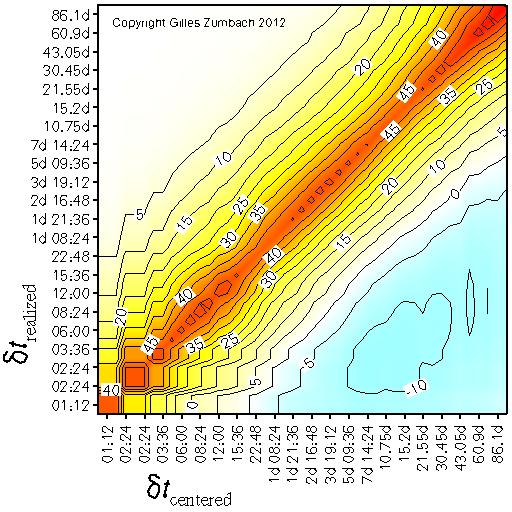 |
The correlation between the centered volatility increment at time horizon dt (horizontal axis) and the realized volatility at time horizon dt' (vertical axis).
This figure shows the dependency structure between the current volatility changes and future volatility. Because the centered volatility change is computed using information in the future, this correlation includes overlapping information. This figure shows essentially the positive correlation between the centered time derivative and the realized volatility. |