| |
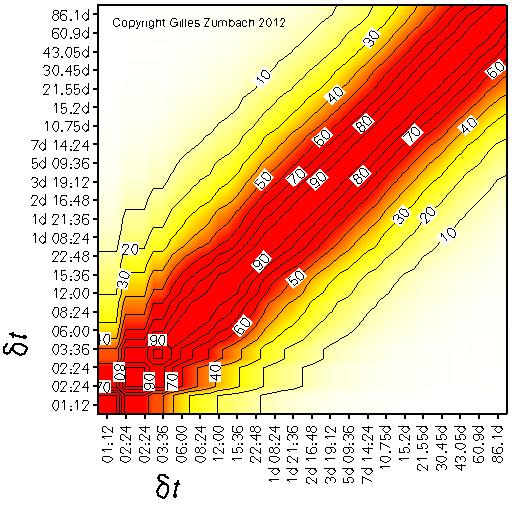
This set of figures shows the correlation with the centered volatility increment. This gives a measure of the correlation structure in the volatility dynamic.
Correlation for the volatility increments at different time horizons |
|
|
The correlation between the centered volatility increment
at time horizon dt (horizontal axis)
and itself at time horizon dt' (vertical axis).
For the empirical data, this correlation decays fairly fast with increasing time difference. This shows the weak correlation structure across time horizons in the volatility dynamic. |
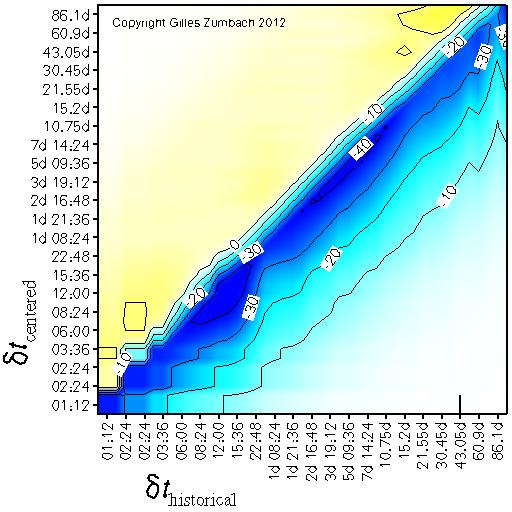
Correlation between the historical and centered volatility increments |
|
|
The correlation between the historical volatility increment
at time horizon dt (horizontal axis)
and the centered volatility increment at time horizon dt' (vertical axis).
The negative correlations are due to the "mean reverting" behavior of the volatility, namely a volatility increase is likely followed by a decrease (and vice-versa). |
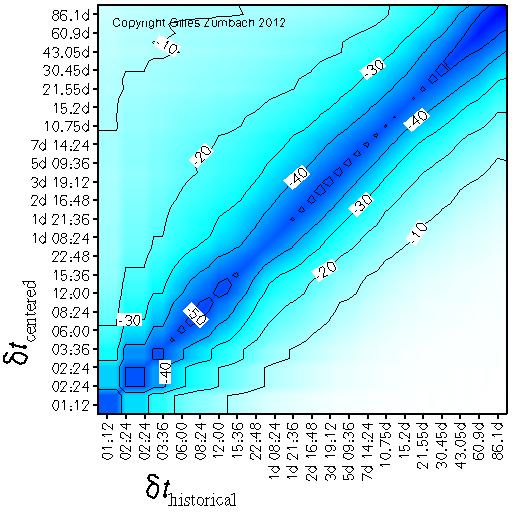
Correlation between the volatility increment and the historical volatility |
|
|
The correlation between the historical volatility at time horizon dt (horizontal axis)
and the centered volatility increment at time horizon dt' (vertical axis).
This figure gives another view of the dominant "mean reverting" behavior of the volatility: a high (low) volatility is likely followed by a decrease (increase). |