| |
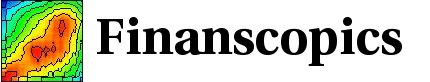
Relative excess kurtosis for the return |
|
|
The goal of the relative excess kurtosis is to measure the deviations of a pdf from a Gaussian distribution, similarly to the kurtosis.
This page displays the relative excess kurtosis for the return, volatility and change in volatility, for a range of time interval dt (horizontal axis), and for a range of exponents k from 1 to 4.
The (usual) excess kurtosis is the difference between the ratio of the fourth moment and the second moment square and the same ratio for a Gaussian distribution (i.e. 3). The excess kurtosis measures the importance of the tails (the fourth moment of the empirical pdf), in dimensionless unit (the ratio with the second moment square), compared to this ratio for a Gaussian distribution. Around this idea, there is several way to generalize this "distance" using the k-th moments. We use the ratio between the k-th moment and the k/2 moment squared, multiplied by the inverse of this ratio for a Gaussian distribution, and from which 1 is subtracted. For all k, the relative excess kurtosis is constructed so as to converge to zero when the empirical pdf converges to a Gaussian distribution. For large k (small k), it measures the convergences of the tail (the center of the pdf) toward a Gaussian. For an iid process, the relative excess kurtosis converges as a power law toward zero for an increasing time interval. On the graph beside, the horizontal axis for the time intervals is logarithmic. Therefore, for an iid process, we should observe an exponential convergence toward zero (as function of ln(dt)). The salient feature of the empirical data is the very slow convergence to a Gaussian pdf. This convergence appears to be logarithmic for most empirical time series. |
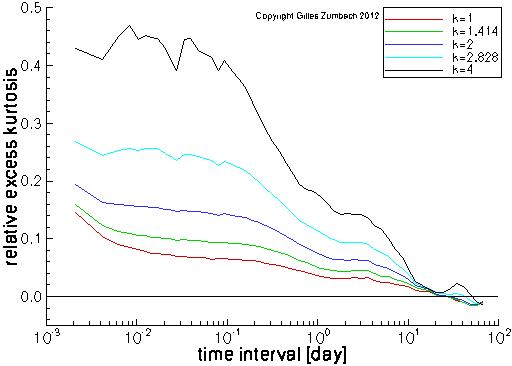
Relative excess kurtosis for the volatility |
|
 |
The same quantity, computed for the volatilities. |
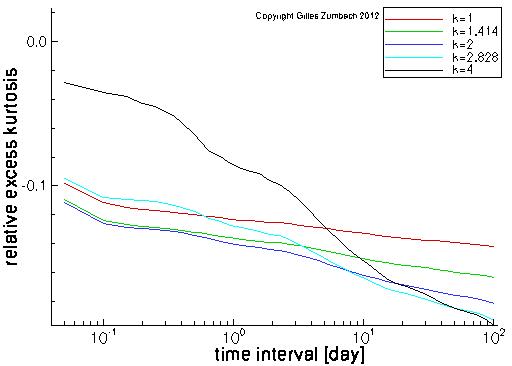
Relative excess kurtosis for the volatility increment |
|
 |
The same quantity, computed for the volatility increments. |