| |
Lagged correlation for the absolute value of the return |
|
|
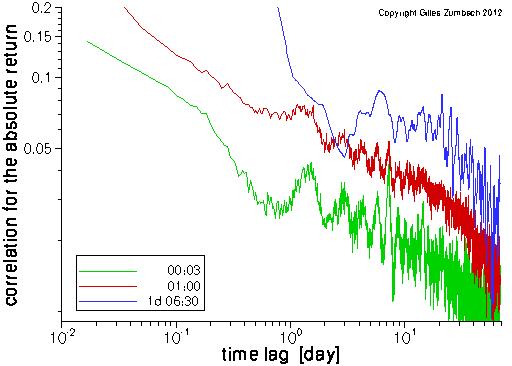
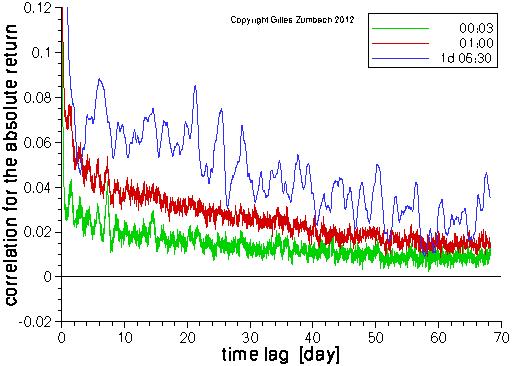
The lagged correlation for the absolute value of the returns (i.e. a measure of volatility).
The computations are done for the returns computed at 3 time intervals: 3 minutes, 1 hour and one business day.
The same curves are plotted in lin-lin and log-log scales. The computations are done for all the returns on a 3 minutes grid for the time lag. For the returns at long time horizons (e.g. dt = 1 day), the overlap between the returns results in a slow decay at lag shorter that dt. The salient feature of the empirical statistics is the slow decay of the lagged correlation. The log-log plot shows that the lagged correlation can be described by a power law in a broad range of time horizons. Yet, the decay is faster for lags larger than 1 month, and other analytical shape can be used. |
Lagged correlation for the square of the return |
|
|
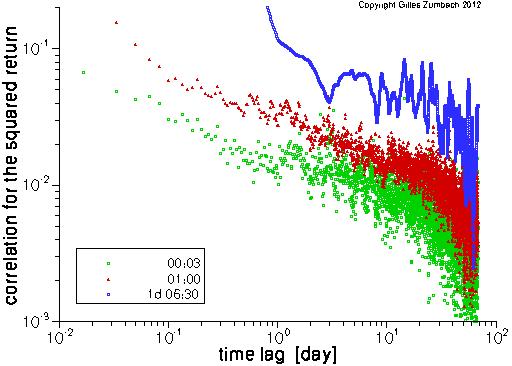
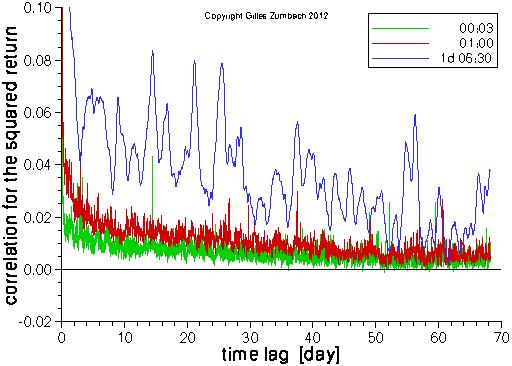
As above, but for the squared return.
Notice that the symbols on the graph partly hide the ones plotted before,
in the order green - red - blue.
The same overall features appear for the lagged correlation of r2 and of |r|. The major difference is the lower values for the correlation of the return square. This originates in the smaller correlations for the large returns. |
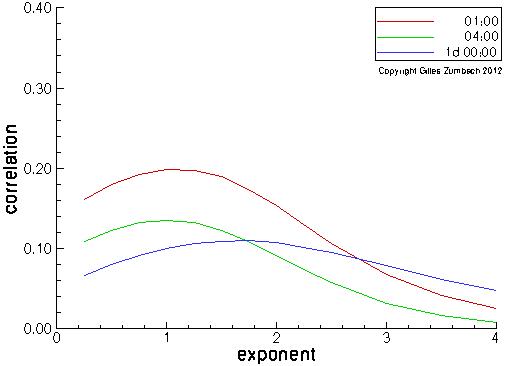
Lag 1 correlation for different exponents |
|
|
For a return at a given time horizon (1h, 4h, 1d), take its absolute
value and raise to an exponent between 0.25 and 4.
Then, compute the correlation with its lagged value, with the lag given by the return time horizon (i.e. such that there is no overlap between returns).
This measures the degree of dependency of the size of the (non-overlapping) returns. Small returns are emphasized with a small exponent, whereas the dependencies for large returns are measured with a large exponent Empirically, the maximum dependency occurs for exponent around 1, although this is depending on the time horizons. |