| |
Both figures in this page measure the influence of the historical price path on the realized volatility. In a broad sense, both are measuring the influence of trend on volatility. The first one seeks for directional effect (up or down trend), whereas the second one measure the influence of trending market versus drifting market on volatility.
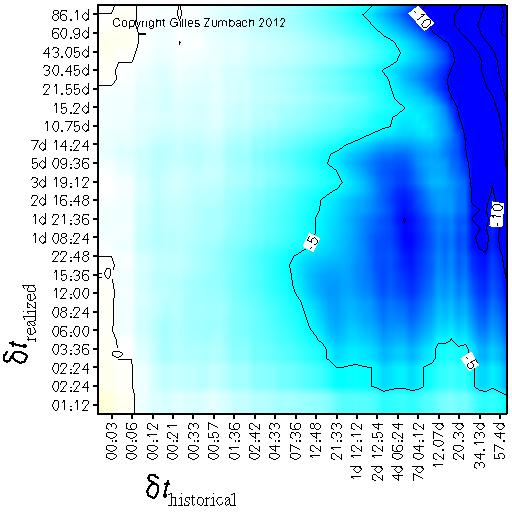
Leverage effectThe correlation between the realized volatility and the historical return. |
|
|
The correlation between the historical return at time horizon dt (horizontal axis),
and the realized volatility at time horizon dt' (vertical axis).
This correlation measures the influence of raising or falling prices
on the subsequent volatilities.
For foreign exchange time series, a symmetry between the "per" and "exchange" currencies can be expected. If this symmetry holds, then this correlation should be zero. For stocks, an empirical negative correlation between past returns and realized volatilities has been documented, and is called the leverage effect. An argument to explain the asymmetry between raising and falling prices is the following: falling prices induce selling, and hence volatility. This argument leads to a negative correlation. |
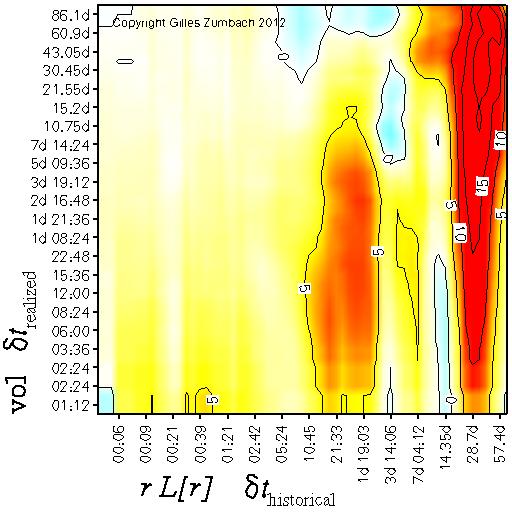
Trend effectThe correlation between the realized volatility and the product r L[r] of the historical return and lagged historical return. |
|
|
The correlation between the product r L[r] of historical returns r and lagged historical returns L[r], both at time horizon dt (horizontal axis),
and the realized volatility at time horizon dt' (vertical axis).
This correlation measures the influence on the subsequent volatility of historical trending versus drifting prices.
The product of the returns is such that there is no overlap between both returns. At the time t, the product is given by r[dt](t) r[dt](t-dt). This product is even in the return, and is positive when both returns have the same signs and negative when both returns have different signs. This product of returns measures if the past price path corresponds to a trend in the market (both returns have the same sign) or to drifting market condition (both returns have opposite signs). Intuitively, we can expect that price swings induce trades, hence volatility. This argument leads to a positive correlation between r L[r] and the realized volatility, as is indeed observed on empirical data. The empirical pattern is again non uniform, but shows maxima at time intervals corresponding to human activity cycles. |