| |
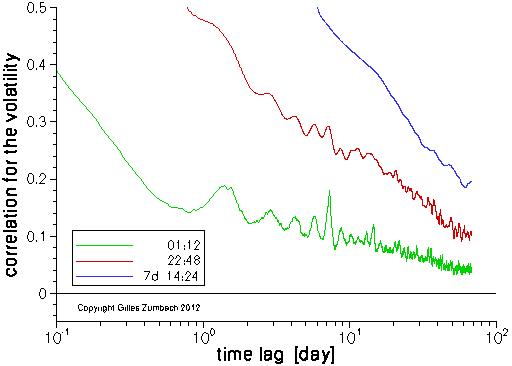
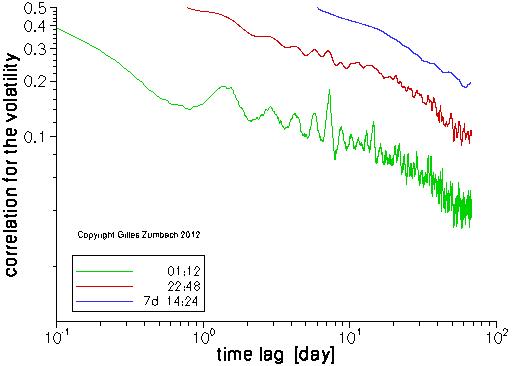
Lagged correlation for the volatility |
|
|
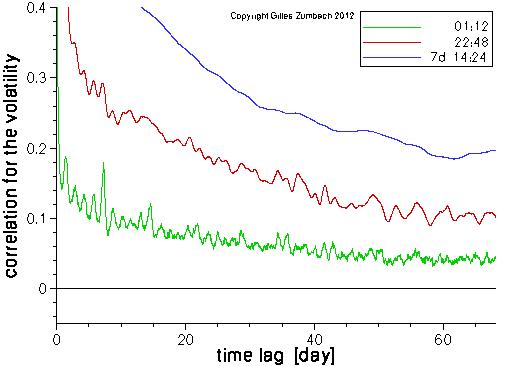
The lagged correlation for the volatility. The volatilities are computed over 3 time horizons, roughly corresponding to 1 hour, 1 day and 1 week.
The same statistics are displayed in lin-lin, lin-log and log-log scales.
The slow decay of the lagged correlation is clearly visible. The log-log plot (third graph) shows that the lagged correlation is correctly described by a power law, but with a faster decay for time horizons above 1 month. Yet, the lin-log graph (second graph) indicates that a decrease according to the logarithm of the lag provides for a better explanation of the empirical behavior. |
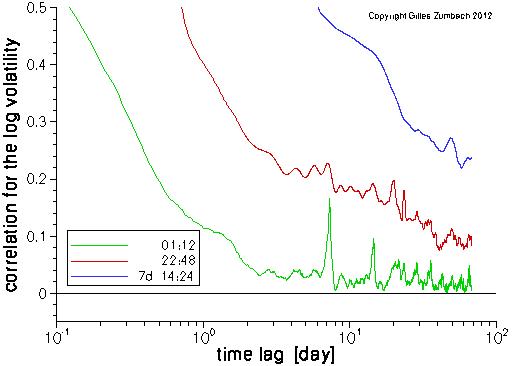
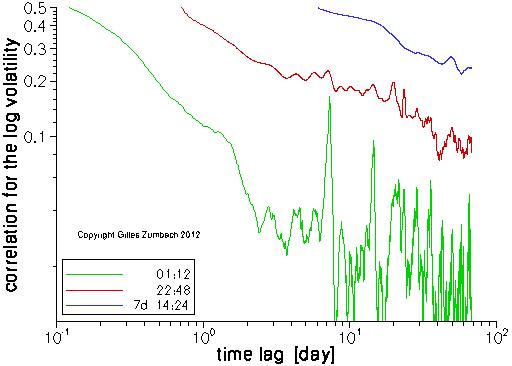
Lagged correlation for the logarithm of the volatility |
|
|
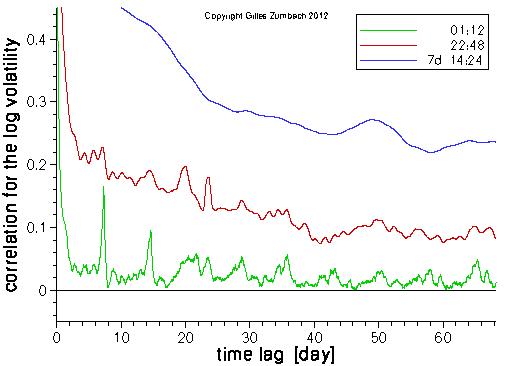
The lagged correlation for the logarithm of the volatility for 3 time horizons.
The same data are represented in lin-lin, lin-log and log-log scales.
The same slow decay of the correlation is also clearly visible. |