| |
These graphs explore in more details the dependency between volatility changes and the historical volatility. The idea is compute the relation between the centered volatility increment and the historical volatility, conditional on the historical volatility.
Conditional average of the centered volatility increment, conditional on the historical volatility |
|
|
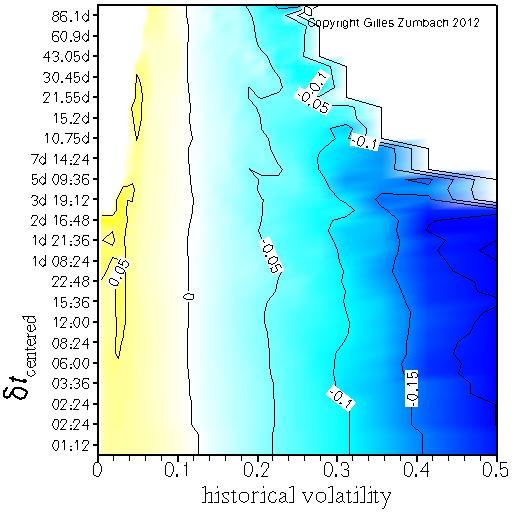
This graph shows the conditional average of the centered volatility
change dσ0[dT] at time scale dT (vertical axis),
conditional on the historical volatility σ[dT]
at the same time scale dT: E[dσ0[dT] | σ[dT] ]. The horizontal axis gives the value of the volatility used for conditioning the expectation. The vertical axis gives the time horizons dT for the historical volatility and the volatility increment. The empirical figure displays the mean reverting behavior of the volatility, namely the volatility change is mostly negative (positive) when the historical volatility is large (small). |
Conditional correlation between the centered volatility increment and the historical volatility, conditional on the historical volatility |
|
|
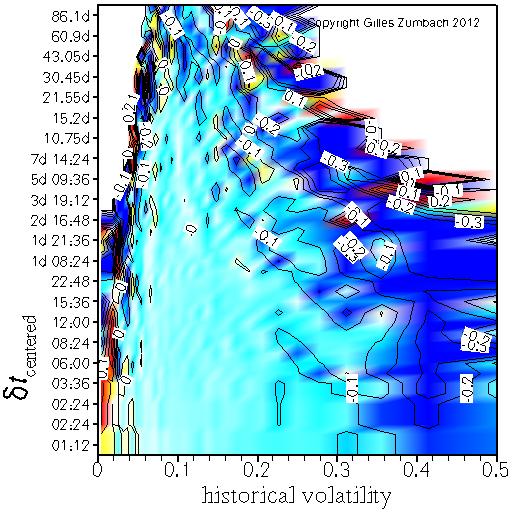
For the same quantities as above, this figure shows the conditional correlation between the historical volatility (at time horizon dT) and the centered volatility increment (at the same time horizon dT), conditional on the historical volatility.
The horizontal axis gives the value of the volatility used in the conditioning. The vertical axis gives the time horizon for the historical volatility and the volatility increment. |